


ESG used Controlled-Source Electromagnetics (CSEM) at two separate well operations in the Anadarko Basin to analyze completion design and study fracture treatment effectiveness. This was the first diagnostic to show aggregate fracture geometry.
Many problems can arise during the stimulation of an unconventional well, such as thief zones, stress shadowing, and fracture-driven interference. However, it can be difficult to visualize the appropriate solution. A novel application of Controlled-Source Electromagnetics (CSEM) can help monitor and image hydraulic fracturing operations.
Challenge
Two separate well operations in the Anadarko Basin faced common fracturing hazards and required fluid tracking to provide mitigation insight.
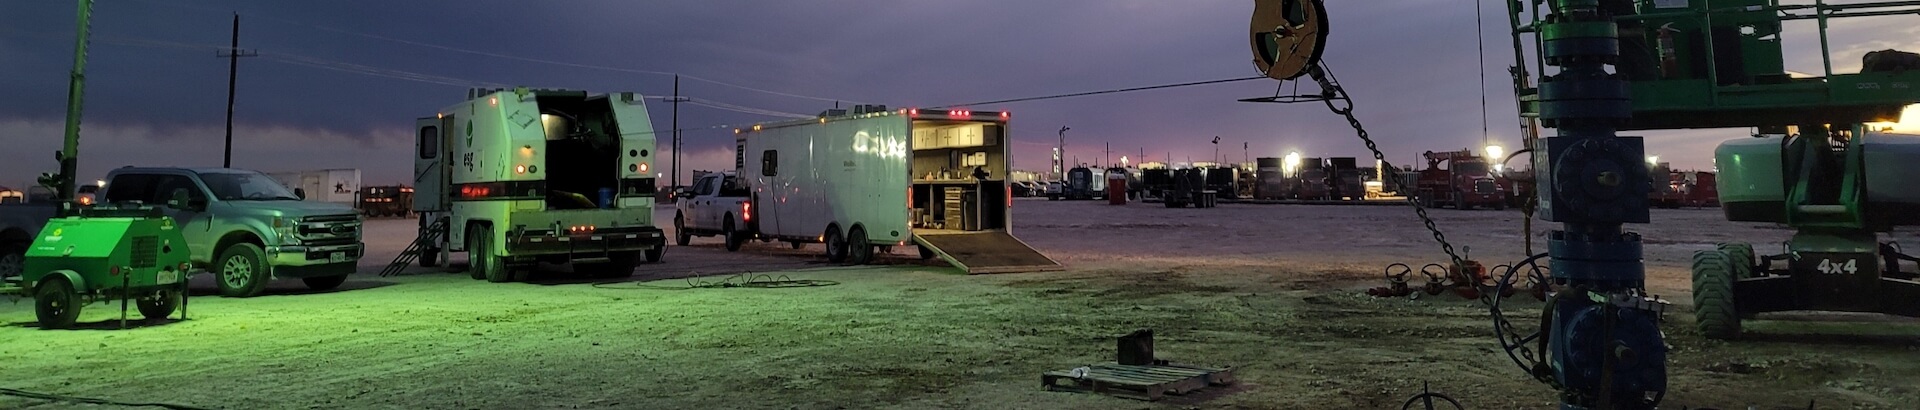
ESG Solution
For both operations, we used surface-based, controlled-source electromagnetics and a dense network of receivers to measure, monitor, record, and map changes in the electric field created by conductivity contrast of the frac. Data was recorded over the course of the well and refined into a map-view motion picture indicating where fluid flowed. The clients’ engineers were then able to adjust designs or confirm success before completing the next well.
The Operation 1 well was used to test a new completion design with treatment stages 25% shorter than in the previous design. The goal was to increase fracture intensity and stimulate rock volume to improve production. To determine the effectiveness of the design, we monitored the stimulation with electromagnetic fluid tracking.
Results showed that stress shadowing effects and inter-stage interference were greater than expected. We noted that the new design did not create more effective fracture geometry or increase production. The client returned to their previous completion design but realized completion cost savings over their multi-well development program as a result of our monitoring.
In Operation 2, we used fluid tracking to understand the geologic influence on fracture treatment effectiveness. Nearly half of the monitored section, Stages 9 through 21, initiated in a limestone layer, with the other half in a shale layer. Stage 21 also had a geologic anomaly in proximity, likely a large natural fracture network, that could hinder induced fracture development. Fluid tracking was used for this stage to determine if avoidance efforts were effective.
Stages 9–14 (limestone) showed lower signal gradients, greater fracture lengths, and greater symmetry than Stages 15–20 (shale), indicating different geological complexity. Stage 21 was also found to be dominated by its nearby geologic anomaly. Fluid tracking results showed layer behavior and identified the ineffective results of avoidance efforts around the fracture network.


