

15th International Conference on Greenhouse Gas Control Technologies, GHGT-15 15th-18th March 2021 Abu Dhabi, UAE
Quest CCS Facility: Microseismic System Monitoring and Observations
Stephen Harveya*, Simon O’Briena, Sara Minisinib, Steve Oatesb, Mohammed Braimc
aShell Canada Limited, 400-4th Avenue SW, Calgary. AB. T2P 2H5, Canada
bShell Global Solutions International B.V, Grasweg 31, Amsterdam. 1031 HW, The Netherlands
cESG Solutions, 20 Hyperion Court, Kingston. ON. K7K 7K2, Canada
Abstract
In August 2015, CO2 injection commenced at the Quest Carbon Capture and Storage (CCS) Facility located near Fort Saskatchewan, Alberta, Canada. Quest is a fully integrated CCS facility with a capture target of just over one million metric tonnes of CO2 per year. CO2 is injected into a deep saline aquifer, the Basal Cambrian Sandstone (BCS), at a depth of about two kilometers below ground.In order to demonstrate containment and conformance of the injected CO2, a Measurement, Monitoring and Verification (MMV) plan has been implemented. Although Quest is in an extremely quiet tectonic location, induced seismicity has been recognized as a potential risk for all large-scale injection sites. As a result, microseismic monitoring is a key component of the Quest MMV Plan to ensure the continued assessment of that risk and to provide early notice of any changes.The aim of this presentation is to detail why we monitor for microseismic activity and how we do this efficiently using proactive technical monitoring (PTM) and exception based surveillance (EBS), to report on six years of microseismic monitoring observations through the pre- and post-start of injection periods and to describe the empirical analysis that has allowed the Quest CCS Facility to de-risk microseismicity as an active threat to containment.Microseismic data is continuously recorded at the Quest CCS storage site using a commercial downhole geophone array installed in a deep monitoring well (DMW). The data are processed to produce trigger files using a common algorithm for event detection and triggering, based on the ratio of short-time-average to long-time-average (STA/LTA) amplitudes. The triggered events are analyzed, classified and reported daily. Categories for various trigger types are defined based on the characteristics of each event. Operationally, the status of the microseismic array is continually assessed by the presence of trigger events. A trigger event is defined to be locatable when it shows clear primary (P) and secondary (S) wave field arrivals. The locatable events are processed and located using an anisotropic velocity model. The p-wave velocities were derived from a vertical seismic profile survey, and the s-wave velocities were obtained from sonic well logs.Pre-CO2 injection recording of microseismic data began in November 2014. Most of the trigger files generated were related to surface, automatic and noise triggers. These events were used to assess the health of the system. No locatable events were detected during the pre-injection monitoring phase.
The first locatable event was recorded 10 months after start of CO2 injection in July 2016 with a magnitude of -1.3. Since January 2017, sustained low level, small magnitude microseismic activity have been located within the Quest microseismic area of review (AOR) within the Precambrian basement. The AOR as defined in the 2017 Quest MMV plan, extends 10 km radially outwards from each active injection well (IW). As of December 31st, 2020, 486 locatable events have been detected, with an average magnitude of -0.7, a maximum magnitude of 0.8 and a typical occurrence rate of 1-2 events per week. Using the current methodology, all locatable events have been located within the Precambrian basement, below the injection zone. None of this microseismic activity has represented a risk to containment.
Keywords: Carbon Capture and Storage; Monitoring, Measuring and Verification; Microseismic; Induced-Seismicity.
1. Introduction
The Quest Carbon Capture and Storage (CCS) Facility is a fully integrated commercial scale CCS facility located at the Scotford Industrial Complex, near Fort Saskatchewan, Alberta, Canada (Fig. 1). The Quest Facility is a Shell operated joint venture between Canadian Natural Upgrading Limited (an affiliate of Canadian Natural Resources Limited), Chevron Canada Oil Sands Partnership (an affiliate of Chevron Canada Limited) and 1745844 Alberta Ltd. (an affiliate of Shell Canada Limited). The Facility captures, transports, injects and safely stores approximately one million metric tonnes of CO2 each year, with the intent to operate at these injection rates for 25 years [1].
As part of the storage scheme at Quest, a Monitoring, Measuring and Verification (MMV) plan is in place to ensure safe storage of CO2. The plan is risk-based and designed to ensure containment and conformance of the CO2 throughout all stages of the operation and abandonment. Technologies are in place to monitor all domains of the Storage Facility including the atmosphere, biosphere, hydrosphere, geosphere, and wells [2].
Microseismic monitoring methods were assessed during the Quest project phase as an important aspect of the Quest MMV plan. Modelling during the project phase indicated that a downhole array was sufficient to monitor microseismic activity within the Storage Complex. This microseismic technology has been in operation at Quest since November 2014. The successful utilization of this technology required feasibility studies and data collection pre-injection. Nine months of data were collected pre-injection. As of December 31st, 2020, no microseismic activity has been located within the Storage Complex which has allowed the Facility to de-risk microseismicity as an active threat to containment.

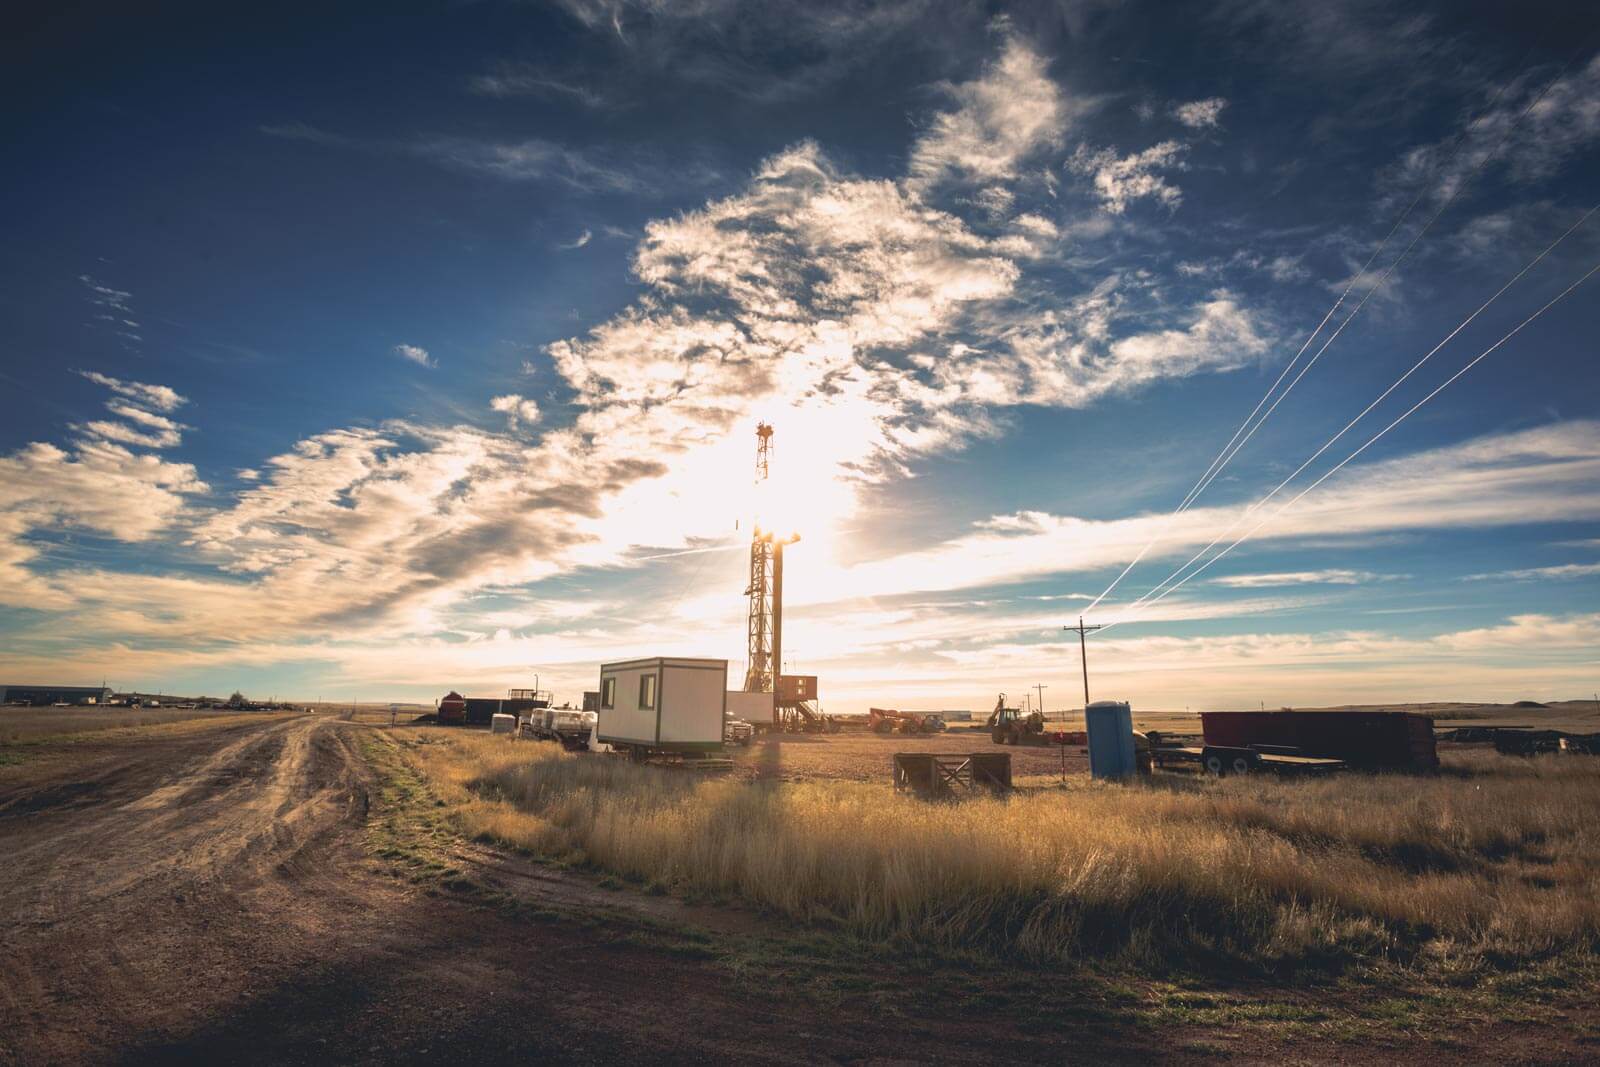
Fig. 1. Quest is a fully integrated CCS facility which includes capture, transport, injection and storage of the CO2. One million tonnes of CO2 are captured annually. The CO2 is compressed and transported by dedicated pipeline 65 km north of the Scotford Industrial Complex. The CO2 is then injected into three dedicated CCS wells and permanently stored two kilometers underground in the reservoir within the Storage Complex.
Low level, small magnitude microseismic activity has been located within the microseismic area of review (AOR) deep beneath the Storage Complex in the Precambrian basement. These locatable events were first recorded 10 months after injection commenced and became a regular occurrence after 16 months of continuous injection, detecting approximately 120 locatable events per year. These events have not demonstrated an elevated risk to CO2 containment within the Storage Complex.
The downhole array consists of eight levels of three component geophones. The raw analog data is continuously digitized at 0.25 ms and temporarily stored on a server ring-buffer located at the well site. The short-time-average to long-time-average (STA/LTA) amplitude ratio technique is used to continuously scan the digitized data for event detection. This technique is common within industry and can include several modified versions which use the absolute amplitude energies or the envelope function of the seismic trace to compute STA/LTA [3, 4, 5]. When a predefined threshold is met, a file is cut from the digitized data stream and pushed to a third-party for processing. Each day, the third-party reports to Quest, detailing trigger activity from the day before. An internal exception-based surveillance (EBS) method is used to determine what daily response is required.
Quest operates as an integrated facility to capitalize on operating processes governed under a single leadership. Proactive technical monitoring (PTM) is a site process and has been established to reduce cost and time in operations, downtime of equipment, and catalogue operational knowledge of systems. PTM requires clear documentation and procedures in place to maintain each component of the system. Once implemented, PTM enables an effective response to daily EBS methods which further reduces the cost and effort required to monitor.
As of 2020, the Quest Facility has safely injected over five million tonnes of CO2 into three injection wells (IWs). Microseismic technology has contributed to demonstrating containment of CO2 during this period. As CO2 injection continues for the next 20 million tonnes, the added value and continued utility of microseismic monitoring at Quest will continue to be evaluated. The mechanism which generates low level, small magnitude microseismic activity deep within the Precambrian basement is not well understood. Although the Quest downhole array was designed to monitor for microseismic activity within the Storage Complex, it has been sensitive enough to detect these events in the basement. Further analysis of Precambrian basement activity will provide value to the Quest Facility, the CCS industry and the Induced Seismic community.
Nomenclature
AOR
BCS
CCS
DMW
sFTP
EBS
ESG
GR
HMU
WI
LTA
MMV
P
PTM
S
STA
UPS
Area of review
Basal cambrian sandstone
Carbon capture and storage
Deep monitoring well
Secure file transfer protocol
Exception-based surveillance
Engineering seismic group
Gutenberg-richter
Hydrogen manufacturing unit injection
Well
Long-time average
Monitoring measuring and verification
Primary wave
Proactive technical monitoring
Secondary wave
Short-time average
Uninterrupted power supply
2. The Quest CCS Facility
The Scotford Industrial Complex includes a refinery, heavy oil upgrading facility and chemicals plant. The Quest CCS Facility is part of the heavy oil upgrading facility, capturing CO2 produced during the production of hydrogen at three Hydrogen Manufacturing Units (HMUs). The CO2 captured from the HMUs accounts for about one third of the upgrading facility emissions. The operating model for Quest is to store all CO2 that is available for capture by an HMU. The intent of this operating model is to ensure that transportation and storage are not limiting factors in the CCS Facility performance. CO2 is captured from the HMUs using Amine technology [1, 6]. The CO2 is then stripped, and the Amine is recycled back into the system. The CO2 is dehydrated to >99% purity and compressed to ~10 MPa for transportation by pipeline to the Storage Facility which consists of three IWs on three dedicated well sites, approximately 65km north of the Scotford Industrial Complex [2]. The storage site is considered world class due to its good injectivity and exceptional seals, combined with excellent monitoring access for containment verification and conformance mapping. The Storage Complex is a 350m thick leased package which includes the Basal Cambrian Sandstone (BCS) reservoir, capped by the Middle Cambrian shale and the Lotsberg salts. These seals are ~165m thick and are regionally extensive (Fig. 2). Above the Storage Complex, the overburden consists of ~1100m of a generally flat and extensive sedimentary package. Lithologies are typical of the Western Canadian Sedimentary Basin and include interbedded shales, sands, salts, carbonates and coals [7]. The main trapping mechanism for the stored CO2 is stratigraphic, due to the generally flat geology. The distribution of CO2 within the reservoir is modelled to move out radially and uniformly within the perforated sections. The theoretical expectation is that CO2 will favour high permeability streaks during injection, and buoyancy will favour the slight dip direction to the northeast.

Fig. 1. Quest is a fully integrated CCS facility which includes capture, transport, injection and storage of the CO2. One million tonnes of CO2 are captured annually. The CO2 is compressed and transported by dedicated pipeline 65 km north of the Scotford Industrial Complex. The CO2 is then injected into three dedicated CCS wells and permanently stored two kilometers underground in the reservoir within the Storage Complex.
The BCS is a 40m thick reservoir with the highest quality sands in the bottom 30m perforated for injection. The high-quality injection interval has an average of ~17% porosity and ~1000mD permeability across the Storage Complex. The reservoir is 540 million years old and sits directly above the Precambrian basement. The hydrostatic pressure at this depth is ~21 MPa with an in-situ brine temperature of ~60 degC. A permeability anisotropy ratio (Kv/Kh) of approximately 0.01-0.1 means CO2 preferentially flows horizontally from the well, allowing for stable injection [8].
To store one million tonnes of CO2 per year, the Facility injects approximately 150 tonnes of CO2 per hour. Due to the high quality of the reservoir, a delta reservoir pressure of ~1-2 MPa is all that is required to inject the full volume of CO2 into the reservoir at a temperature of ~30 degC at two kilometers depth. With a fracture pressure >35 MPa, the wells operate far below the operating fracture limit. Although three IWs are active, it is not uncommon to inject using only two of the three wells. From 2015 to 2018, injection was evenly distributed between two of the three IWs. The third IW commenced injection in late 2018, and since then injection volumes have been distributed evenly between the three IWs (Fig. 3) [7, 8, 9].

Fig. 1. Quest is a fully integrated CCS facility which includes capture, transport, injection and storage of the CO2. One million tonnes of CO2 are captured annually. The CO2 is compressed and transported by dedicated pipeline 65 km north of the Scotford Industrial Complex. The CO2 is then injected into three dedicated CCS wells and permanently stored two kilometers underground in the reservoir within the Storage Complex.
Each well site consists of an IW, injection skid, deep monitoring well (DMW), several groundwater wells, a small motor control center building which we refer to as an MMV building, communication antennas and towers, weather station and light source instrumentation. The well sites and pipeline have dedicated operators who work at the remote locations, performing daily checks of critical injection, safety and monitoring systems. The well site operators are the eyes in the field, but critical data is also monitored remotely by control panel operators at the Scotford Industrial Complex. All operators work within a framework with predetermined operating envelopes to ensure safe storage of CO2. The operators can cease injection and shut-in the IWs at any time.
3. Quest MMV Plan
The Quest CCS Facility license to operate requires an MMV plan to ensure the safe, long-term storage of CO2. In recent years several international authorities have published guiding principles for MMV plans of CCS projects which underscore the importance of site-specific risk assessments that are adapted to storage performance over time [10]. The data collected and analyzed as part of the MMV plan ensures containment and conformance of the CO2 throughout all stages of the operation and abandonment. The Quest MMV plan is adaptable based on operational activities and analysis and updated every three years. In addition, annual reporting and knowledge sharing are published on a yearly basis and made available publicly [2, 9]. The MMV plan was developed to monitor the atmosphere, biosphere, hydrosphere, geosphere and wells (Fig. 4). In general, the atmosphere and biosphere technologies are surface-based, hydrosphere technologies are within ground water wells and geosphere and well integrity technologies are deployed within the DMWs and IWs. The MMV plan is designed to be comprehensive and risk based and includes many different and often redundant technologies or activities to collect data [11, 12, 13]. Conformance technologies collect data to demonstrate that the reservoir models are consistent, properly calibrated and relevant for current operations. Containment technologies monitor for deviation from defined thresholds and have triggers related to changes in subsurface containment risks. Tiered nomenclature is used to distinguish containment technologies. Tier 1&2 technologies monitor active threats while Tier 3 technologies collect contingency data to support potential responses to Tier 1&2 based monitor activities or non-technical risk.
All wells were drilled in 2010 and 2012. The IWs are the only three points of penetration into the BCS reservoir in the AOR. The lack of any nearby legacy well penetrations is an example of the high-quality site selection that has integrated passive barriers to maintain a low containment risk– the nearest well penetration into the BCS is over 20 km away. The operational performance and an updated bowtie risk analysis in the 2020 MMV plan has identified the IWs as the highest risk to long-term containment. This analysis has highlighted near and in-well monitoring as the primary containment monitoring technologies [2]. Five years of consistent injection and data collection has demonstrated that the Quest storage site is a world class location for a Storage Facility.

Fig. 4. Schematic Plan of Quest’s monitoring program. For downhole microseismic monitoring, replacement decision upon failure will be made based on operational risk profile at time of failure, in consultation with the Regulator and Government of Alberta.
4. Microseismic as a Containment Technology
Microseismic activity within the Storage Complex was evaluated as a low risk to containment during the project phase. A single downhole microseismic array was deployed November 2014, within DMW 8-19 as it is located at the central of three well sites. Microseismic technology is currently a Tier 2 technology monitoring for microseismic activity within the Storage Complex which may indicate a risk to containment. The array is a site-specific design to monitor for this risk. The microseismic AOR as defined in the 2017 Quest MMV plan extends 10 km radially outwards from each active IW [2]. Activity located outside of this AOR is considered regional data and not recorded as a locatable event or kept as a long-term record. As of December 31st, 2020, no events have been located within the Storage Complex (Fig. 5). The downhole array has been sensitive enough to detect microseismic activity deep within the Precambrian basement. Similar microseismic behavior has been observed at the Decatur CCS demonstration project as well in the Central US, where seismicity associated with saline water disposal wells is concentrated in the basement, explained to be mediated by permeable connections to the injection interval, releasing tectonic stresses [14, 15, 16].

Fig. 5. a) map view of all locatable events detected within the Quest microseismic AOR up to December 31st, 2020. b) traverse view of events shown in ‘a)’. Events are coloured by magnitude with a dynamic range of -2.0-0.5. The eight-level downhole geophone array is displayed, and the Storage Complex highlighted in yellow.
4.1. The Downhole Array
The downhole array is a semi-permanent installation which means the array is suspended in an open wellbore and can be retrieved. There are eight levels of three component 15Hz analog geophones. Each level consists of a pod with two geophones wired in series for each of the X, Y and Z components. The pods are coupled to the DMW casing using magnetic coupling. A wireline holds the weight of the array and is held tight by a string of sinker bars. The wireline is hung from within the wellhead to ensure adequate pressure control. A total of 24 copper wires exit the wellhead in a coated cable through a high-pressure pack-off. An all-encompassing poly-urethane coating protects the array from the saline Cooking Lake formation fluids present in wellbore as the formation pressures are monitored as part of the MMV plan (Fig. 6). The array design is called the Super Cable and is a proprietary design by a third-party company Engineering Seismic Group (ESG). The downhole conditions at the storage site were unique for the Super Cable deployment at the time of installation, as a Super Cable had not previously been deployed down to depths of 1700m, in a saline environment with a pressure/temperature tool also in place. The third-party has estimated the Super Cable deployment should maintain integrity for about 10 years. When operations enter the DMW for well integrity purposes, the array will be pulled which may result in damages. The Facility can increase the likely life span of the array by deferring entrance into the DMW for as long as possible. As of 2020, downhole components of the array have performed well and have not shown signs of potential failure.
4.2. Surface Components
The single coated cable exits the wellhead and terminates at a junction box a few meters from the wellhead. Analog to digital converters digitize the data every 0.25ms and time stamp the record using global positioning systems. The signal is digitized as close as possible to the wellhead with a shielding cable tray between the wellhead and junction box to further protect the analog signal from surface noise contamination. The digitized data is pushed via ethernet cable from the converters to a server within the MMV building on the well site. The ethernet and junction box power cable are fed through an underground conduit system from the MMV building which reduces cable maintenance costs during operation (Fig. 6).

Fig. 6. Schematic of the Quest downhole microseismic array and supporting components (not to scale). The array is a semi-permanent installation which is magnetically coupled to the casing. The well includes a pressure gauge which monitors the saline fluid pressures of the Cooking Lake formation.
The site server hosts a ring buffer data drive which temporarily stores the continuous data, overwriting the oldest data with the most recent. A proprietary algorithm is hosted within an application on the server. The algorithm scans the continuous data stream for data that meets a specific threshold criterion. When met, a six second trigger file is cut from the data, copied to a second data drive, and automatically pushed from the site to the third-party via microwave transmission and then internet. The third-party can connect back to the wellsite converters and server which allows the third-party to adjust threshold parameters, monitor the health of downhole and surface components and verify locatable microseismic event trigger files against raw continuous data. The power supply to the surface components comes from the grid. The temperature controlled MMV building hosts back up power within an uninterrupted power supply (UPS) system. The microseismic surface equipment is connected to this UPS and hosts its own small Smart UPS with enough power to properly shutdown the equipment operating systems in the event of lost power. Proper system shut down ensures the eventual reboot is seamless. The microseismic system is robust with several points of data back-up. In the six years of operation of the system there has been minimal downtime resulting in data loss.
4.3. Triggering and Data Flow
Many file types are generated by the STA/LTA monitoring method including noise, surface, regional, acoustic and locatable event files. Additionally, an hourly health check file is generated which pulses the downhole components.The system transmits about 40-80 trigger files each day, with about 1-2 locatable events each week. Trigger files are processed daily by a third-party and an update of the previous day’s activity is provided. The locatable events are the trigger files Quest is most interested in as they hold the primary (P) and secondary (S) wave field information related to microseismic activity located within the AOR. The daily report Quest receives from the third-party includes an email documenting the day’s activity and a cumulative catalogue accounting for all trigger files to date. When locatable events are detected, additional event information including northing, easting, magnitude and depth, are sent in an event catalogue along with the raw event waveform. The data flow from the third-party back to Quest is automated once Quest receives data. The third-party uploads the file to a secure file transfer protocol (sFTP) site where a file mover transfers the data to a Quest data repository. Internally, a program runs to sort files and scan the catalogues for any formatting issues or data inconsistencies. The catalogues are converted into various formats which are read by applications for detailed review of the waveforms, comparison against other data types and EBS (Fig. 7). EBS makes use of a flexible graphical interface designed within the MATLAB appDesigner. When the tool is opened, it reads the most recent datasets for review. Quest microseismic EBS is tracking for three key criteria daily. It checks that data has been received and that there are no errors within the data, it checks whether locatable events have been recorded from the day before, and it checks that the depth, magnitude and location of any locatable events are consistent with days previous. These steps can be tedious and time consuming which makes this part of the microseismic data flow a strong candidate for automation. Since implemented, EBS has reduced average daily manual operational surveillance time from ~30min to ~1minute per day. Time is now required only when exception thresholds are met and additional steps are required to either restore the data flow, correct errors or understand a geophysical change in the data [17].

Fig. 7. Quest microseismic data flow. The data is recorded at the Quest well site and transmitted to a third-party for processing. A daily report is sent to Shell using an sFTP. From the point the files are uploaded by the third-party, the data flow and EBS is automated.|
4.4. Enabling Automated Surveillance
Microseismic monitoring activities can be split into operations and data studies. Operations include equipment maintenance, data flow maintenance, daily processing, data management, interpretation and regular reporting. Data studies assess the dataset as it builds over time, changing risks, value of information and short-term and long-term technology strategy. Operating using EBS increases efficiency making more time for data studies. Most of the effort required to enable automated surveillance has come from establishing governance and maintenance plans for the system infrastructure, equipment, software and data repositories. With these aspects of the system in place, it is comparatively minimal effort to integrate data, create trigger thresholds, automate surveillance and begin assessing the potential uses for machine learning. The data flow has been categorized to display how components of the system are interconnected. EBS highlights breakpoints in the system when they occur and PTM establishes the right team to maintain and improve the system. All operating monitoring systems have the same categorical data flow as shown in Fig. 8 which include infrastructure which host sensors, surface equipment and transmission devices, file movers, data lakes and analysis and surveillance tools. The role of project managing the microseismic system is with the data user as they understand the value of the data and can most easily establish the value chain framework for support teams. For long-term sustainable operations of the system, the data user must understand the end to end data flow from sensor to reporting and how the system is maintained.

Fig. 8. The Quest microseismic monitoring system can be broken into categories. These categories will be similar for all operating monitoring systems. The yellow categories include physical equipment and infrastructure at the well sites which require a physical presence to maintain. The blue categories can be managed and maintained remotely. The full system surveillance is most efficiently monitored by the data user as they regularly review the data and understand the value of the data.
4.5. Microseismic Observations
No microseismic activity was detected during the baseline period and first nine months of injection. During this time, Quest used regional events to demonstrate the downhole array sensitivity and verify the absence of activity within the microseismic AOR. In July of 2016, nine months after first injection, the first locatable event was detected within the microseismic AOR. The second locatable event was detected four months after in October 2016 and the third locatable event was detected three months after in December 2016 [18]. Since December 2016, the downhole array has consistently detected ~120 locatable events per year within the microseismic AOR, all located within the Precambrian basement (Fig. 9). It is most common that several locatable events are detected for ~1-2 days followed by a quiet period for ~1-2 weeks.

Fig. 9. a) Locatable event count throughout the year coloured by year. b) The black line shows the cumulative locatable event count while the coloured events shows the spread of event magnitude with time.
The locatable events are spread out across the entire microseismic AOR, within the Precambrian basement. The bulk of the events have been located to several defined locations which we call clusters. Many of the clusters comprise of locatable events which were detected in bursts of activity over several days, while some clusters built over a period. Two of the most prominent clusters recorded many events in a short time frame in 2017 and again in 2019 (Fig. 10). The estimated locatable event locations suggest that the events are spreading out from the injectors over time which we can see best with distance-magnitude plots. We also observe an empirical relationship between distance and magnitude which could be used to estimate the sensitivity limit for the deployed array.

Fig. 10. a)b)c)d) Yearly magnitude distribution of Quest locatable events detected in the Precambrian basement as a function of distance from the array. e) All locatable events detected in the Precambrian basement. Five key clusters are highlighted with yellow, black, green, blue and red boxes. The colour coding of these clusters is consistent with the clusters highlighted in Fig. 13a.
Similar to other CCS facilities like Decatur and In Salah, Quest has not observed a direct correlation between injection parameters (rate, pressure, volume) and seismic response. For Quest and Decatur, injection pressure is considerably lower than fracture pressure and there are no interpreted regional faults connecting layers within the Storage Complex. The occurrence of seismicity and its causality to injection is still under discussion but the processes involved is expected to be complex and have a spatiotemporal evolution potentially masking the causality. Changing pore-pressure, small geological heterogeneities and aseismic deformation are the processes mostly discussed in literature and related to seismic activity in the basement [19, 20, 21, 22]. The calculated event magnitudes over time show a consistent distribution between -1.9 and 0.8 with an average magnitude of about -0.7 (Fig. 11a). The log of the number of events exceeding a specified magnitude against the value of magnitude can be fit to a straight line parameterized according to the Gutenberg-Richter (GR) Law [23]. The intercept of the fit indicates the activity rate, and the slope indicates the relative abundance of event magnitudes. Close to the monitoring well an excess of events is visible as smaller events are detectable at shorter range, and according to the GR Law are more abundant.
The overall detection threshold of the downhole array can be indicated by the point that data starts to fall below the GR fit, known as the magnitude of completeness (Mc). The GR plot for the Quest microseismic data is shown in Fig. 11b with a magnitude of completeness of about -0.5 M and a distribution which consistently appears to follow a b-value regression. Further value may be obtained from these basement events by understanding the mechanism that generates them and the relationship they have to injection parameters. Building a consistent dataset may aid the Facility in adequately assessing the long-term induced seismicity risk due to injection and contribute to the collective knowledge within the industry which can be an analog for future CCS facilities in the area.

Fig. 11. a) Histogram of locatable events up to December 31st, 2020. The average magnitude detected within the microseismic AOR is -0.7. b) Gutenberg-Richter plot, with maximum likelihood fit (a=1.53; b=1.35; Mc= – 0.5).
Quest is currently conducting studies which focus on the statistics of the data collected to date. These studies aim at organizing the data to search for indirect relationships between injection parameters and the locatable events. In addition to these studies, Quest is conducting a geomechanics study to understand the impact injection has on local stress regimes in the reservoir and underlying Precambrian basement.
4.6. Verifying Events
The key containment risks the downhole array monitors for is the indication of fracturing or fault reactivation within the Storage Complex. The risk is inherently very low as injection pressures are well below the fracture pressure and there are no major faults interpreted to interconnect the lithologies of the Storage Complex. The array aperture of <400m is sufficient to monitor for this risk. The lateral continuity of the geology in the microseismic AOR provides good velocity to accurately locate any microseismic event that may be detected within the Complex.
A third-party provides daily data processing following these steps:
The health of the monitoring system is checked to ensure data is collected and transmitted. The signal quality of each sensor is analysed for indication of degrading functionality
Background noise is subtracted from the signal for each channel and a band pass filter is applied. The filtering process is built overtime based on historic data collected by the array and is required to identify clear arrival picks in multiple sensors and to verify the orthogonality between the polarization axes
The azimuth and dip are calculated from the filtered particle motion of the polarization for each triaxial sensor (Fig. 12)
Moment magnitude, energy and source radius are calculated for each event and an error ellipsoid is generated automatically using a Monte-Carlo function
On a quarterly basis the cumulative data are analyzed. The distribution of the location error, time error residual and moment magnitude are verified to identify outliers.

Fig. 12. a) Triaxial view of a locatable event P-arrivals after rotation and filtering. b) Hodogram analysis shows alignment of data points in the direction of particle motion which is assessed to determine the locatable event azimuth. c) Map and traverse view: Unfiltered data or inappropriate filtering can result in picking an inconsistent azimuth and increase the error of the event location. d) Map and traverse view: Filtered data provides a more accurate azimuth pick.
In select cases, the third-party provides additional event verification steps:
- When locatable events with high uncertainty are detected they are compared against events with similar waveform characteristics and the historic distribution of residuals, location error and azimuth error. Commonly, events with low signal-to-noise ratios have a higher source location uncertainty as there is higher error in picking arrival times and ray trajectory estimation
- When artifacts like 180-degree ambiguity and linear growth are present the spatial distribution of the source location is assessed. Error ellipsoids are generated to map probability distribution in 3D for a visual assessment of uncertainty.
Quest has recently started several studies to understand the mechanism which generates locatable events within the Precambrian basement. The downhole array aperture and lack of velocity control in the basement impacts the location uncertainty of these events. One study has focused on assessing uncertainty in event location by characterizing events relative to one another and is described here in detail. An established method was followed to calculate error ellipsoids and cross-correlation coefficients as relative quality attributes [24]. Finite difference waveform modelling was used to characterize the expected patterns of seismogram arrivals for varying event depths and third-party P and S direct arrival time picks on the waveforms were validated. Some minor detailed adjustments were made to arrival picks before calculating event locations. An algorithm that utilises direct arrival picks and particle motion directions was used to determine location estimates for each event. Source-receiver vectors for distant events were directed upwards to constrain potential ±180° ambiguity in the arrival direction calculation. Validation steps showed generally good agreement with third-party event locations giving confidence in event locations received. Locatable events with similar locations and source mechanisms are expected to have similar waveforms which highly correlate, with the correlation coefficient declining as event separation increases. The calculated cross-correlation coefficient between all events is shown in the cross-correlation matrix Fig. 13b. The main event clusters visible in map view Fig. 13a can be identified with the blocks of highly correlated events in the matrix also highlighted in Fig. 10e.

Fig. 13. a) Map view of the first 400 event locations. The size of location dots is proportional to the magnitude while the colour is a function of the time they occurred. The green dot indicates the DMW while the three red stars indicate the IWs. The cluster highlighted in red was recorded as a burst of seismic activity in 2017. Events in the clusters are highly correlated and correspond to the yellow squares along the main diagonal in the cross-correlation matrix shown in b. b) Cross-correlation matrix computed for the first 400 events of the catalogue. Cross-correlation close to one which indicates high waveform similarity. c) Perspective view of event locations with modelled location error ellipsoids for identified clusters. Note the monitoring well and geophones in the distance, as well as the source-receiver rays.
A burst of ~70 events with high wave-form similarity and tight clustering was detected in February 2019. Modelling showed that the spread of this cluster in depth and azimuth was consistent with the location uncertainties expected, indicating the spread was due to uncertainty rather than an underlying geological structure (Fig. 13c). Event location clusters are spread over concentric circular arcs of increasing length with increasing distance from the array since the locatable event azimuth is only constrained by the particle motion vector. For large source-array distances, the angular aperture of the array becomes small, and event depth determinations rely on the particle motion dip angle. Uncertainty of distant locatable events gives distant event clusters large spreads in depth and azimuth. For the February 2019 cluster, the range of event distances are well constrained by the PS time difference, but the depth and azimuth uncertainties are large. The downhole array geometry leads to some instabilities in the location process for deep distant Precambrian basement events with large location uncertainty ellipsoids.
Observation of a continuous stream of events over a range of distances clearly demonstrates that the system is in good operational state and should be able to detect seismicity, if of sufficient magnitude, within the Storage Complex near the array.
4.7. Microseismic Monitoring Roles and Responsibilities
It is expected that microseismic technology at Quest will require dedicated time from a geoscientist for the life of monitoring. The skillsets required to ensure continual data flow and data interpretation include knowledge of facility process, basic understanding of instrumentation and electrical components, digitization of data, digitalization of systems, applications, value chain, IT systems, third-party relations, EBS, PTM, reporting, license to operate and seismology.Quest operational experience as an integrated CCS facility has assessed that the following roles should be established to run a cost effective and efficient microseismic monitoring technology:
Project Phase (CAPEX)
- Geoscientist to assess risk profile through modelling, establish life span of monitoring, determine data requirements to manage risk through operation and abandonment
- Project execution manager to determine well site infrastructure, equipment, power, well site communications, well site servers, application support, corrective and proactive maintenance measures and design and execute system that is integrated into facility process
- IT manager to build framework for data flow from sensor to repository, close integration with intended data user, technology experts and third parties.
First two years of Operation (OPEX Start-up)
- Geoscientist monitors data and establishes appropriate trigger threshold parameters and array sensitivity analysis
- Project execution manager provides hyper care to ensure system is supported through site process, working closely with operators, IT, third parties and data user
- IT manager provides hyper care to ensure proper integration of all data flow components into support teams.
Long term Operations (OPEX)
- Well site operators maintain technology within operating framework
- IT operations maintain data flow within operating framework
- Geoscientist oversees continual data collection and analysis and assesses long term requirements for technology based on the first years of operation; works with well site operators to establish EBS.
Although the responsible party may differ slightly, these roles are required in some capacity for any long-term operating monitoring system whether it is part of an integrated storage facility or not.
5. Conclusion
The Quest CCS Facility is a fully integrated commercial scale facility located at the Scotford Industrial Complex. Over a 25-year period, 25 million tonnes of CO2 will be captured and stored permanently in the BCS reservoir two kilometers underground. Since first injection in August 2015, more than five million tonnes of CO2 have been captured, transported, injected and safely stored within the BCS reservoir. The Quest Storage Complex is a world class storage site as it has laterally extensive, thick, flat lithology, coupled with a high-quality reservoir. As part of the safe storage scheme at Quest, an MMV plan has been implemented to ensure containment and conformance risks are managed for all stages of the operation and abandonment. The MMV plan allows for flexibility in managing site specific risks both effectively and efficiently. Microseismic monitoring has verified the absence of activity within the Storage Complex allowing the Facility to de-risk microseismicity as an active threat to containment.Locatable events within the Precambrian basement are currently considered a low risk to operations as they are low level and small in magnitude. As of December 31st, 2020, 486 locatable events have been detected and located in the Precambrian basement within the microseismic AOR. The events show no apparent direct relationship to injection parameters but there may be an indirect relationship. Both statistical analysis and geomechanical modeling studies of the reservoir and Precambrian basement are being conducted to further understand the mechanism which generates these events. An effective long-term microseismic monitoring technology is made possible through PTM and EBS. Simple but diligent project management during both the project and early operational phases of the facility can allow for efficient implementation of both PTM and EBS which ultimately reduces long-term operating costs while building datasets. Quest is designed to demonstrate the effectiveness of long-term CO2 storage within the Storage Complex. As CO2 injection continues for the next 20 million tonnes, the added value and continued utility of microseismic monitoring at Quest will continue to be evaluated. The mechanism which generates low level, small magnitude microseismic activity deep within the Precambrian basement is not well understood. Although the Quest downhole array was designed to monitor for microseismic activity within the Storage Complex, it has been sensitive enough to detect these events in the basement. Further analysis of Precambrian basement activity will provide value to the Quest Facility, the CCS industry and the Induced Seismic community.
Acknowledgements
The authors of this paper would like to acknowledge the Government of Alberta, the Government of Canada, Natural Resources Canada (NRCan), Shell staff in Calgary, Houston, EU and in the field, 3rd Party Contractors and our joint venture partners Canadian Natural Upgrading Ltd, Chevron Canada, and 1745844 Alberta Ltd.
References
[1] The Quest for less CO2: learning from CCS implementation in Canada. A Case Study on Shell’s Quest CCS Project. Global CCS Institute Publications. 18th November 2015.
[2] Shell Canada Ltd., 2017. Quest 2017 MMV Plan. Retrieved from https://open.alberta.ca/publications/quest-carbon-capture-and-storage-project-report-2017
[3] Allen, R, Automatic earthquake recognition and timing from single traces. (1978) Bulletin of the Seismological Society of America, 68, 1521-1532.
[4] Earle P S, Shearer PM., Characterization of global seismograms using an automatic-picking algorithm. (1994) Bulletin of the Seismological Society of America, 84, 366-376
[5] Trnkoczy A.Understanding and parameter setting of STA/LTA trigger algorithm. (2002) In:Bormann., P.(Ed.), IASPEINewManual of Seismological Observatory Practice,vol.2. GeoForschungsZentrumPotsdam, pp.119
[6] Singh, A., & Stephenne, K. (2014). Shell Cansolv CO2 capture technology: Achievement from First Commercial Plant. Energy Procedia, 1678-1685. doi:https://doi.org/10.1016/j.egypro.2014.11.177
[7] Shell Canada Ltd., 2011. Quest Storage Development Plan. Retrieved from https://open.alberta.ca/dataset/quest-carbon-capture-and-storage-project-report-2011
[8] Shell Canada Ltd., 2011. Quest Generation-4 Integrated Reservoir Modelling Report. Retrieved from https://open.alberta.ca/dataset/quest-carbon-capture-and-storage-project-report-2011
[9] Shell Canada Ltd., 2020. Quest CCS Annual Summary Report - Alberta Department of Energy:2019. Retrieved from https://open.alberta.ca/publications/quest-carbon-capture-and-storage-project-annual-report-2019
[10] Carpenter, M., Kvien, K., & Aarnes, J. (2011). The CO2QUALSTORE guideline for selection, characterization and qualification of sites and projects for geological storage of CO2. International Journal of Greenhouse Gas Control, 942-951. doi:https://doi.org/10.1016/j.ijggc.2010.12.005
[11] Jones, D.G., Chadwick, R.A., Pearce, J.M., Vincent, C.J., Hannis, S., Long, D., Rowley, W.J., Holloway, S., Bentham, M.S., Kingdon, A., Arts, R., Neele, F., Nepveu, M., Vandeweijer, V., Metcalfe, R., Bond, A.E. and Robinson P.C. (2010) MMV - Measurement, Monitoring & Verification of CO2 Storage: UK Requirements: Final Report - Vol 1
[12] Bourne, S., Crouch, S., & Smith, M. (2014). A risk-based framework for measurement, monitroing and verification of the Quest CCS Project, Alberta, Canada. International Journal of Greenhouse Gas Control, 109-126. doi:https://doi.org/10.1016/j.ijggc.2014.04.026
[13] Dean, M., & Tucker, O. (2017). A risk-based framework for Measurement, Monitoring and Verification (MMV) of the Goldeneye storage complex for the Peterhead CCS project, UK. International Journal of Greenhouse Gas Control, 1-15. doi:https://doi.org/10.1016/j.ijggc.2017.03.014
[14] Goertz-Allmann BP, Gibbons SJ, Oye V, Bauer R, Will R, Characterization of induced seismicity patterns derived from internal structure in event clusters.(2017) J. Geophys. Res. Solid Earth, 122.
[15] Johann L , Shapiro S, Dinske C, The surge of earthquakes in Central Oklahoma has features of reservoir induced seismicity, (2018) Scientific Reports 8:11505
[16] Langenbruch C, Zoback MD. How will induced seismicity in Oklahoma respond to decreased saltwater injection rates? Sci. Adv. 2,
[17] Harvey, S. (2020). Microseismic Digitalization at the Quest CCS Facility. MATLAB Energy Conference 2020. Mathworks. Retrieved from https://www.mathworks.com/company/events/conferences/matlab-energy-conference/2020/proceedings.html#section1
[18] Oropeza Bacci, V., Tan, J., Halladay, A., & O'Brien, S. (2018). Microseismic activity after 2+ years of CO2 injection at Quest. In SEG Technical Program Expanded Abstracts (pp. 3052-3056). Retrieved from https://library.seg.org/doi/abs/10.1190/segam2018-2996295.1
[19] Rutqvist, J, The Geomechanics of CO2 storage in deep sedimentary formations, (2012) Geotech. Geol. Eng., 30, 525–551.
[20] Das, I., and M. D. Zoback, Long-period long-duration seismic events during hydraulic stimulation of shale and tight-gas reservoirs, (2013)—Part 2: Location and mechanisms, Geophysics, 78(6), 97–105. [21] Eaton, D., M. van der Baan, J. B. Tary, B. Birkelo, N. Spriggs, S. Cutten, and K. Pike, Broadband microseismic observations from a Montney hydraulic fracture treatment, northeastern BC, Canada, (2013), CSEG Recorder, 38(3), 44–53.
[22] Zecevic, M., G. Daniel, and D. Jurick, Questioning the existence of hydraulic fracturing-induced LPLD events in a Barnett Shale, (2016) Texas,microseismic dataset, paper presented at Sixth EAGE Workshop on Passive Seismic.
[23] Gutenberg, B., and C. Richter, 1942, Earthquake magnitude, intensity, energy, and acceleration: Bulletin of the Seismological Society of America, 32,163–191.
[24] Arrowsmith S J,Eisner L, A technique for identifying microseismic multiplets and application to the Valhall field, North Sea, (2006), Geophysichs, vol. 71, no.2.